Posts

PI Objective Score

It’s about the PI Objective Potential… the ‘Planned Score’, not about the ‘BusinessValue’

  • In every adoption / transformation I have supported there is invariably a need to provide clarification on what Business Value means for a PI Objective
  • There tends to be confusion with the reference to the word ‘business’ being used in the context of the PI Objective value, what is business value, and what about having to do work that has technical value?
  • We can argue that technical value also has business value, but we’re just playing word games
  • Perhaps the reference to business value is a lean toward the desire (need) for the wording of the PI Objective to be meaningful for those with a business point of view
  • We can still emphasize the importance of expressing PI Objectives in a language that is relevant to business rather than technology people, but we can drop the ‘business’ prefix for PI Objective value
  • We can keep the reference to value, but in this context, ‘value’ conveys to the teams information they need for localized decisions, not necessarily value in the context of the economics of the benefit hypothesis or the post-release value realization
  • We’ll remain value-focused, but for PI Objective value, let’s consider the value to be like a score for the PI Objective… scoring to indicate the expected potential of the PI Objective outcome

PI Objectives

At the start of the last PI Planning Event, we had a quick introduction to a more structured way to score PI Objectives that supported a broader view and supported a platform initiative to make tradeoffs in support of disproportionate value relative to utilization of platform capacity. We also realized a need to improve the clarity of each PI Objective by being more specific and to improve our ability the know that each PI Objective would provide a measurable contribution to a key result that would indicate that the platform was moving toward a strategic theme objective.

The process of providing additional clarity required deeper conversations and alignment on outcome expectations. The focus on being able to measure contribution reinforced the desire to focus on high-value, high-priority that is aligned with the strategic direction of the platform.

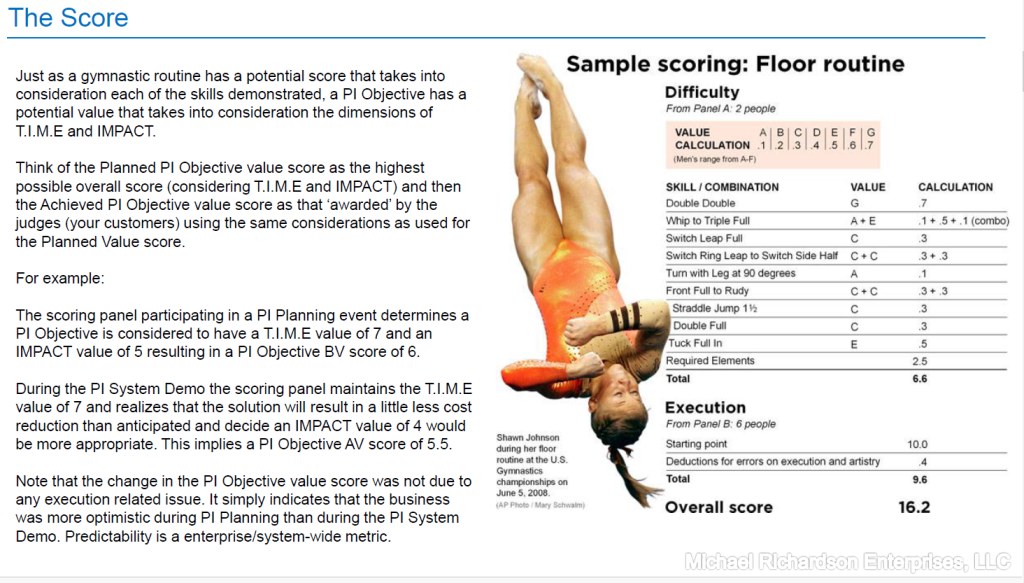
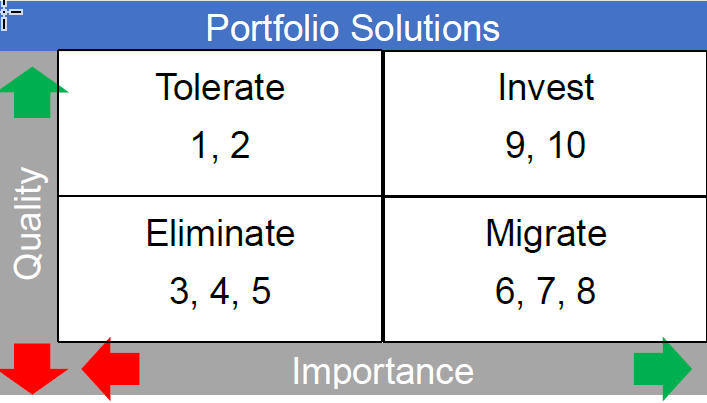
The structured scoring approach introduced a two-dimensional model for deciding on a PI Objective score. The first dimension referred to as T.I.M.E considers the strategic importance and operational quality of the application / solution / business capability that would be affected by the work to deliver on a PI Objective.

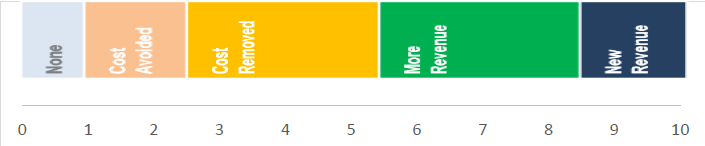
The second dimension of IMPACT indexes the expected economic benefit of the outcome of delivering on a PI Objective.

The PI Objective planned value score is the sum of the two-dimensional indices divided by two.

During the Program Increment teams should refer to the PI Objective planned value score as an indicator of where they should be focusing their capacity. This aligns with using T.I.M.E. and IMPACT as a more structured way to score PI Objectives to make tradeoffs in support of disproportionate value relative to utilization of platform capacity.

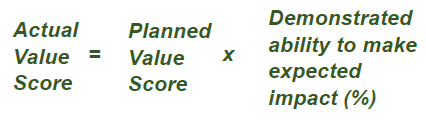
During the Program Increment demonstrations, the context should be set to that of the PI Objectives. The teams worked hard with the business and product owners to write PI Objectives that were specific and measurable. With the clarity of what was expected and how the impact would be measured the demonstration feedback can be more focused and is a significant consideration in determining the PI Objective actual value score..

Setting the PI Objective actual value score does not require revisiting the T.I.M.E and IMPACT. It does, however, require the same panel of people who set the PI Objective planned value score. The same panel of people along with having written the PI Objectives to be specific and measurable improves the recall of considerations made up to 3 months earlier when setting the PI Objective actual value.

When all goes well the demonstrated ability to make the expected impact is 100%. There is no need to be exact. If less than 100% then lower the PI Objective actual value by 1 point, or more if that better expresses the judgement of the panel. Likewise, if the demonstration shows the potential to get more than 100% of the expected impact the raise the PI Objective actual value by 1 point, or more if that better expresses the judgement of the panel.

Ultimately, the Predictability Measure should be used as a continuous improvement mechanism. The Predictability Measure is not a delivery performance metric. It is an indicator for the ability of ‘the business’ / system to stand up and score the value of an outcome (as expressed by a PI Objective) before it is built, the predictability measure indicates the collective ability to understand the customer, the customer’s pains, and the possible gains, as well as the ability of the people who are implementing the solution to understand both.

NextGen Case Study

Case Study: NextGen Healthcare

Accelerating Value Delivery Through a SAFe-based Operating Model Refresh

Executive Summary:

NextGen Healthcare, a leader in healthcare technology solutions, embarked on a significant initiative to refresh its operating model and streamline product delivery. Recognizing the need for improved data-driven decision-making, enhanced sustainability, and continuous improvement, NextGen partnered with an Enterprise Transformation Coach to leverage the Scaled Agile Framework (SAFe). This collaboration resulted in the successful establishment of a lean-agile, flow-based operating model, leading to significant improvements in delivery speed, quality, and alignment with strategic objectives.

The Challenge:

Prior transformation attempts within NextGen Healthcare faced challenges in gaining widespread leadership buy-in and achieving sustainable change. The existing delivery structures operated in silos, hindering data aggregation and consistent application of best practices. This resulted in long release cycles (1.5+ years), low planned/completed ratios (~35%), and significant work-in-progress (WIP). The need for a unified approach to product delivery, improved forecasting, and better alignment between technical work and strategic goals became critical.

The Solution:

A SAFe-Based Transformation

An experienced Enterprise Transformation Coach collaborated closely with NextGen’s leadership, including the CTO and SVPs/VPs, to architect and implement a refreshed operating model based on the Scaled Agile Framework (SAFe). The approach was characterized by:

  • Empathy and Gradual Change: Recognizing past challenges, the transformation was approached with empathy, assuring stakeholders that the journey would be collaborative and adaptive. A series of minimum viable changes were introduced to meet the organization where it was and build momentum.
  • Leadership Buy-in: Securing strong leadership support was paramount. The coach effectively communicated the “What’s In It For Me” (WIIFM) by leveraging a technology background and building trust.
  • Data-Driven Roadmap: Lean-Agile maturity models, assessments, and interviews were employed to create an 18-month transformation roadmap. Needs were translated into a prioritized backlog of stories, managed with leadership feedback to ensure measurable outcomes.
  • Establishment of Agile Release Trains (ARTs): Seven Agile Release Trains were stood up, forming the backbone of the new delivery structure. This facilitated alignment, collaboration, and consistent delivery across product lines.
  • Coaching and Mentoring: Extensive coaching was provided to leadership (CIO, SVP, VP), product management, ART Release Train Engineers (RTEs), Product Owners, Scrum Masters, and development teams. This included guidance on Agile principles and practices, facilitating initial PI Planning events, and clarifying roles and responsibilities.
  • Jira/eazyBI Optimization: A significant effort was undertaken to standardize and optimize the use of Jira and eazyBI across 500+ users. This involved designing consistent issue types, screen layouts, workflows, transitions, automation, and validators (JavaScript). This initiative alone saved an estimated $2,500 per day by eliminating redundant configurations and enabling enterprise-wide data aggregation.
  • Performance and Operational Metrics: The coach guided the definition of Objectives and Key Results (OKRs) and Key Performance Indicators (KPIs). Performance and operational metrics (Cycle time/Delivery speed, Quality/Defect rate, ROI) and reporting mechanisms were developed to track progress and demonstrate the benefits of the new operating model.
  • Internal Playbook and Training: An internal playbook and training curriculum were collaboratively developed to support the transition and ensure the long-term sustainability of the new operating model.
  • Re-architecting Tooling: The tooling landscape, particularly Jira and SharePoint, was re-architected to align with the new operating model and facilitate seamless collaboration and information flow.
  • Scaling Agile: A team of seven internal and external coaches was led to transform the 1700+ employee Product Delivery Organization into a single portfolio with six product lines and eleven quarterly cadenced delivery team-of-teams, encompassing over 80 agile delivery teams.

Results:

The implementation of the SAFe-based operating model yielded significant positive results for NextGen Healthcare:

  • Improved Delivery Speed: Release cycles were dramatically reduced from 1.5+ years to quarterly releases.
  • Increased Predictability: The planned/completed ratio improved significantly from ~35% to ~85%.
  • Reduced Waste: Work-in-progress (WIP) was reduced by approximately 80%.
  • Enhanced Quality: The percentage of User Stories with Acceptance Criteria increased significantly, ranging from ~5% to 67%, indicating a greater focus on clear requirements and quality.
  • Data-Driven Decision Making: Standardized Jira configurations enabled data aggregation, providing valuable insights for roadmaps, quarterly planning, and portfolio management.
  • Cost Savings: The Jira/eazyBI optimization resulted in estimated savings of $2,500 per day.
  • Improved Alignment: The new operating model fostered better alignment between technical work and strategic objectives, leading to economically prioritized work and improved capacity planning.
  • Cultural Transformation: Coaching and the focus on shared learning and adaptation contributed to a more agile and collaborative organizational culture.

Conclusion:

Through a strategic and empathetic approach leveraging the Scaled Agile Framework, NextGen Healthcare successfully refreshed its operating model. The transformation led to tangible improvements in delivery speed, quality, predictability, and cost-efficiency. By fostering leadership buy-in, providing comprehensive coaching, and optimizing key tools, NextGen Healthcare established a foundation for continuous improvement and sustained success in delivering innovative healthcare solutions. The case study highlights the power of a well-executed SAFe implementation in driving significant organizational agility and business value.

How the need for the CDR Model was identified

Starting with WSJF, which is the suggested prioritization for enterprises adopting SAFe, people find that the variables used to estimate the cost of delay are not well aligned with the typical language used when prioritizing defects. We tend not to talk about the value of fixing a defect, the reduction of risk, or the business opportunity created when fixing defects.

When discussing defects the conversation often considers how many people are affected, the impact on these people, and the severity of that impact. For this conversation, the RICE prioritization model is a better fit for the language used. Looking at the first 2 parameters we see that this model provides a better alignment with the conversation:

  • Reach represents the number of people affected, and
  • Impact represents the consequence of the defect’s effect.

The shortcoming with RICE, when used with defects, is that it, like most prioritization models, is intended to be used on a single backlog of similar items. But, not all of the work in a backlog is the same type of work. A backlog typically has a number of work types, such as New Features, Work on Technical Debt, or Maintenance items. SAFe handles this using Capacity Allocations. Defects are another type of work and should have a capacity allocation, but then there are sub-categories for defects that we need to consider.

Introducing the CDR Model

Classification-aware Defect Ranking (CDR) Model

For enterprises that have a significant backlog of defects,
Who are dissatisfied with their current prioritization approaches,
The Classification-aware Defect Ranking (CDR) Model,
Provides clarity on those parameters to be considered for an objective approach to determining a ranking score that is the basis for prioritization,
Unlike other ranking approaches that tend to be subjective and inadequate in capturing the various considerations.

For the CDR Model defect classification is based on a mandate to repair and breadth of exposure (who knows about the defect).

The CDR Model uses this classification along with inputs for Reach, Impact, Confidence, Pressure, and Understanding to calculate a Defect Ranking Score.

So many defects, what do I do?

I’m really excited about a new model that I have developed for defect prioritization. I’ll be introducing the model soon. Return here for more information and watch LinkedIn where I will post an artiicle about the model, schedule a webinar on the topic, and offer a course.

Follow my company on LinkedIn at: Michael Richardson Enterprises, LLC

Or, follow me on LinkedIn at: Michael Richardson